Genome Complexity Browser
Welcome to the Genome Complexity Browser (GCB) documentation.
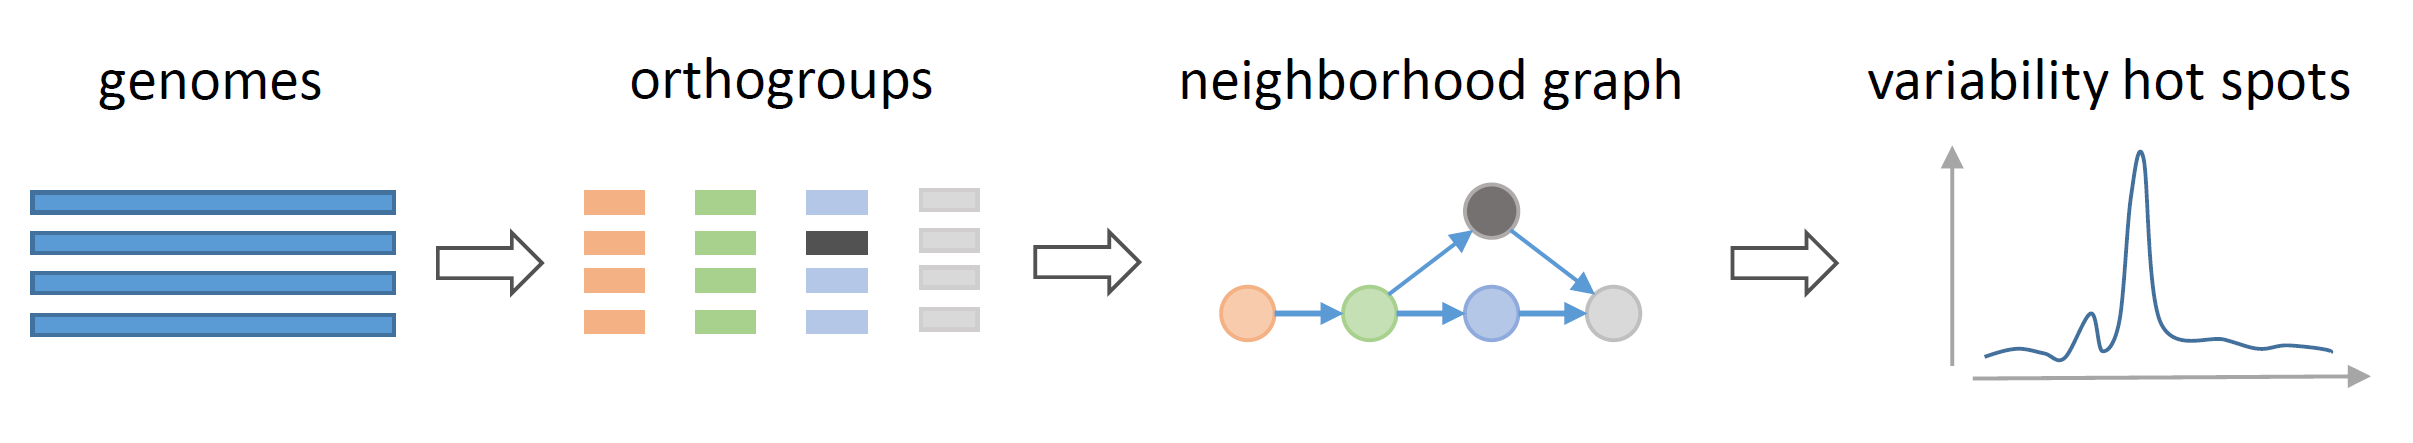
GCB is created to analyse variability in hundreds of prokaryote or viral genomes simultaniously.
GCB performs:
- Visualization of gene neighborhoods in a graph-based format.
- Quantification of local genome variability.
The graph-based visualization may facilitate answering questions:
- Is a gene (operon) located in the same location in all genomes? If not, then what alternative genes are present?
- Which parts of a gene set (operon) are conserved and which are variable?
- Which genomes contain some particular combination of genes?
Local genome variability profile may be used to identify:
- Hotspots of horizontal gene transfer or other local gene rearrangement events.
- Cold spots, regions of the genome with virtually no changes in the considered set of genomes.
The GCB is available as a web server and as a standalone application. Web server contains precalculated data for 143 prokaryote species. Standalone version allows to analyze a custom set of genomes (basic command-line skills will be needed).
You can find screen recordings of GCB here (Youtube).
GCB paper is published in:
Manolov, A., Konanov, D., Fedorov, D., Osmolovsky, I., Vereshchagin, R., & Ilina, E. (2020). Genome Complexity Browser: Visualization and quantification of genome variability. PLOS Computational Biology, 16(10), e1008222. https://doi.org/10.1371/journal.pcbi.1008222
Contents:
- Main concepts
- GUI description
- Standalone version
- Frequently Asked Questions
- What is this curvulin in the Complexity panel?
- Why do you call it complexity, not variability?
- What are those circles and lines in the Graph panel?
- How node name is selected?
- Does all variants that present in considered set of genomes are represented in the graph visualization form?
- Where should I take coordinates of genes of interest?
- How can I obtain graph image in vector format for publication?
- What if genome of interest is absent at gcb.rcpcm.org?
- Can I run standalone version on Windows?
- What genome sets can be used in a standalone version?
- Can I use PC for the standalone analyisis or do I need a computational cluster?
- How many genomes may be analyzed in a standalone version?
- Can I adress someone to help me with my organisms?
- Contacts